OneTeg User Interface - Dashboard
The Dashboard is the starting page of the OneTeg system. Here you can see general information about your system; the number of Flows and Steps that are active and running, the latest activities, and steps executed during the last month.
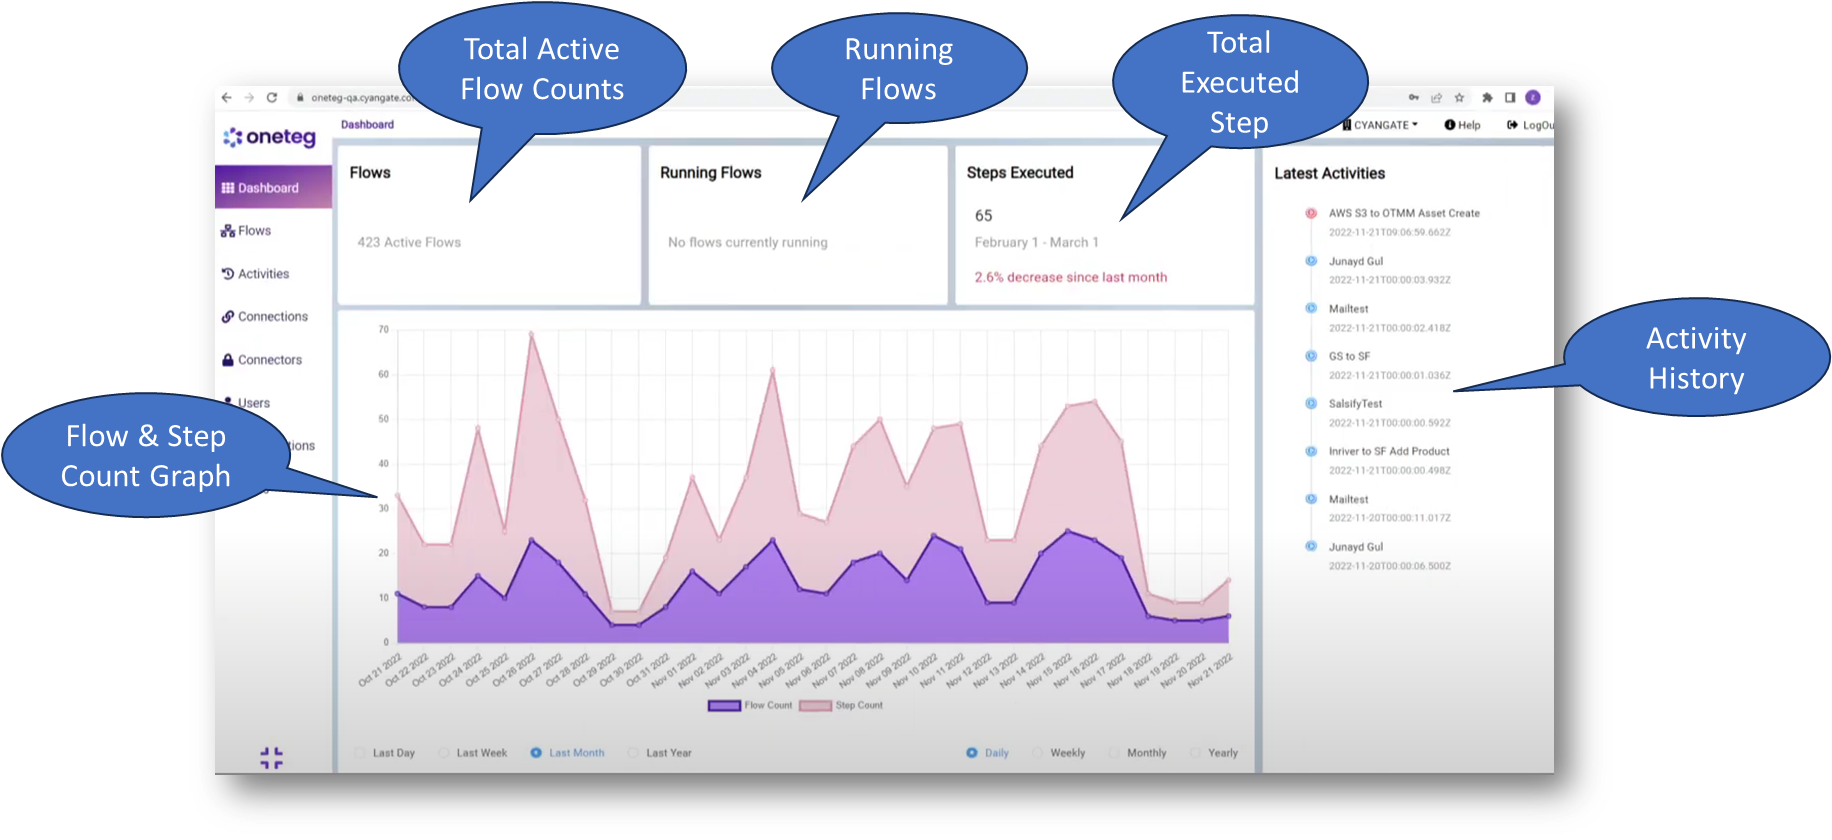
The graph can be personalized by selecting the relevant radio button. Additionally, the total values for both Flow Count and Step Count can be hidden by clicking the corresponding option.